Ricochet is the best place on the internet to discuss the issues of the day, either through commenting on posts or writing your own for our active and dynamic community in a fully moderated environment. In addition, the Ricochet Audio Network offers over 50 original podcasts with new episodes released every day.
 A Few Thoughts on Obama’s Final Jobs Friday
Beyond the topline numbers — 156,000 jobs, 4.7% unemployment rate — some really good stuff in the December jobs report, the last one of the Obama presidency. The labor force participation rate ticked up, while the U-6 underemployment-unemployment rate ticked down to its lowest level since April 2008. A record 75 straight months of employment growth. But here is the biggie: Wages climbed 2.9% over the past year, the strongest growth since June 2009.
So how does the Obama economy go out after coming in during a time of recession and financial crisis? Well, the GDP numbers tell a pretty gloomy story, but the job market offers a bit brighter one about the economy. I am inclined to think jobs might be more informative statistic here. This is in line with my view that possible productivity mismeasurement could result in GDP numbers understating the true pace of economic growth. At the same time, both boosting productivity growth and labor force participation need to be prime priorities of the next administration.
A few thoughts from the pros:
Published in Economics“With wage growth climbing again and price inflation set to rise well above 2%, the modest drop-off in employment growth won’t stop the Fed from tightening monetary policy more aggressively this year. Assuming a big fiscal stimulus arrives in the second quarter, we expect four 25bp rate hikes this year.” – Capital Economics
“Overall, this report was somewhat softer than we had anticipated. The weakness in services sector employment offsets some of the optimism from the rise in manufacturing employment. When judging the economic outlook, we take considerable signal from employment growth. To our mind, the slowing in this report and on average in the second half of 2016 is consistent with late-cycle behavior of labor markets. However, the slowing is not yet sufficient to trigger substantive recession concerns, in our view. Further, in the near term, we continue to expect aggressive fiscal stimulus this year to offset recession risk, effectively extending the cycle.” – Barclays
“With the economy at or near full employment, this is not a bad thing, especially if labor productivity growth strengthens. The jobs gains of the last two years cannot be sustained without seriously straining the job market. Second, despite the erratic monthly pattern, wage inflation is trending up. This is not only evident in the data released by the Bureau of Labor Statistics, but can also be seen in other wage surveys, such as the one done by the Atlanta Federal Reserve Bank. … For the first time in many years, the Federal Reserve is beginning to worry about an overheating labor market. The minutes of the December FOMC meeting clearly reflected this. The December jobs report will likely add to those worries.” – IHS Markit

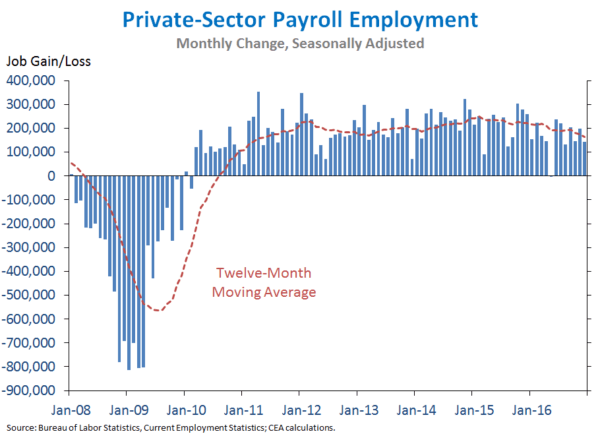
150K jobs per month would only (more or less) keep the unemployment number from rising, based on population growth and labor force participation. Even your chart has a slight decline in the moving average in terms of jobs created, which is not what I would call a positive indicator. The length of the recession and its attendant, cinderblock-weighted job growth numbers, along with the stagnation in wages, tells you something about the mix of job types that have been created, and they’re not great ones.
I think most of that is understood. What’s interesting is that the “pros” who’ve been in love with ZIRP for years, and seen its mediocre at best results in terms of employment growth, wage growth, etc, are now calling to put the brakes on with interest rate hikes.
Consumer confidence, new housing starts, etc, tell a bigger story about what expectations are. That expectations have gone up as administrations change hands tells one hell of a lot about the workforce and employers.
What’s odd is anyone in the Barry administration claiming victory based on any of these numbers. In the best case, give credit where its due scenario, his policies did no more than maintain status quo. There’s no significant growth, as mentioned in the GDP numbers, and much of that growth during his administration is due to the massive overhang of debt he doubled in federal spending.
Income only runs through 2015 at the fed, but it’s still below where Barry started (in 2008) for almost all 8 years. This is a train wreck of a stat.
Worse, when compared to the prior recession, the recovery trough for incomes is deeper and longer. So while I get Barry is fantastic at taking credit for things to bolster his fragile, sissified ego, the reality out here in the sticks is that his economic policies made things worse, not better, and it takes an administration turnover to change consumer outlook:
I would be very interested in a graph showing a longer time span. Do you have data for a decade or two before 2008? Our economy has flat-lined, based on casual observation and our worker participation ratio, over the last eight years, but as a basis for judging performance, we need a temporally longer graph.
Trinity, our friends at the St. Louis FED have a rather dizzying array of data that goes back as far as records were kept. Here’s that same chart over a longer timeline. There are a lot of other factors at play here, in terms of incomes, but the labor force participation rate is kind of shockingly bad. That incomes drop as people leave the workforce – for a host of reasons, lots of it due to retirement but that’s not all of it by far – incomes go down, but they’re still making money. It’s just that a lot of it was in the form of entitlements, including the ridiculous extension of unemployment benefits. If you’re going to pay people to be idle for a year, well guess what – a lot of them will choose to be idle for a year and get paid for it.
https://fred.stlouisfed.org/
My go-to jobs number is from the Household Survey….Employed-Usually Work Full Time
Those numbers indicate that for December the economy generated a mere 35,000 Full Time jobs.
You can see the data at the St Louis Fed’s website. Look for data series LNS12500000.
https://fred.stlouisfed.org/graph/fredgraph.xls?chart_type=line&recession_bars=on&log_scales=&bgcolor=%23e1e9f0&graph_bgcolor=%23ffffff&fo=Open+Sans&ts=12&tts=12&txtcolor=%23444444&show_legend=yes&show_axis_titles=yes&drp=0&cosd=1968-01-01&coed=2016-12-01&height=238.5&stacking=&range=Custom&mode=fred&id=LNS12500000&transformation=lin&nd=1968-01-01&ost=-99999&oet=99999&lsv=&lev=&mma=0&fml=a&fgst=lin&fgsnd=2009-06-01&fq=Monthly&fam=avg&vintage_date=&revision_date=&line_color=%234572a7&line_style=solid&lw=2&scale=left&mark_type=none&mw=2&width=318