Ricochet is the best place on the internet to discuss the issues of the day, either through commenting on posts or writing your own for our active and dynamic community in a fully moderated environment. In addition, the Ricochet Audio Network offers over 50 original podcasts with new episodes released every day.
 The April Jobs Report: America’s Coke Zero Recovery Continues
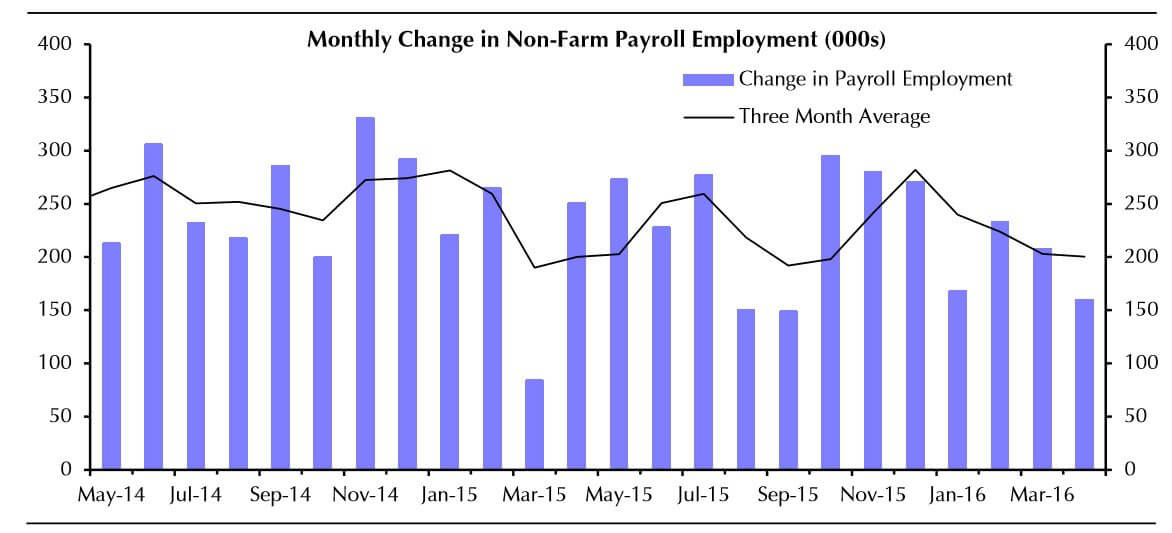 The US economy generated 160,000 net new jobs last month, lighter than the 200,000 consensus forecast. (Biggies Goldman Sachs and JP Morgan went even higher.) The unemployment rate held steady at 5.0%. We’re now up just over 14 million jobs since the 2010 job market low.
On the plus side, the broader U-6 unemployment/underemployment rate edged lower, there were big drops in long-term unemployment, and average hourly earnings increased by a respectable 0.3% with the annual growth rate accelerating to 2.5% from 2.3%.
On the downside: Both the labor force participation rate and employment-population ratio fell by 0.2 percentage points. That’s disappointing, though not exactly surprising.
Capital Economics summed things up this way: “Employment was never going to continue rising at more than 200,000 a month indefinitely. Those monthly gains are simply unsustainable in an economy with a potential economic growth rate of less than 2%.” Maybe so, but some analysts are already saying the soft report means the Yellen Fed will not raise interest rates next month. The Brexit possibility is probably also a factor supporting caution.
A bit more color from Barclays:
We now only expect one rate hike in 2016, in September, down from two hikes previously, as we believe it will take longer for policymakers to accumulate sufficient evidence that economic and labor market activity is rebounding after a soft start to the year. We also believe some FOMC members would prefer to see the outcome of the UK referendum before moving to hike rates again. … Wages continue to firm, albeit at a modest rate. … The payroll proxy, an indication of growth in nominal household wage and salary income, is now up 3.4% 3m/3m saar (previous: 4.4%). … Should employment rebound as we expect it will, household incomes can still easily achieve 4% growth in the first quarter. … LFPR reverses part of the recent rise … The labor force participation rate fell two-tenths to 62.8%, retracing a third of its recent rise. Together, softer employment and a decline in the labor force kept the U3 unemployment rate unchanged at 5.0% (4.984%, previous: 5.001%). The decline in LFPR came in line with our view that the recent rise was unsustainable and likely a result of sampling variation. A more stable trajectory for LFPR alongside better employment growth in the months ahead should continue to push the unemployment rate lower throughout this year.
So this week, lousy productivity numbers and this “meh” jobs report. The Coke Zero economic recovery — certainly not my first choice but if that’s all you got, OK — continues.
Published in Economics
Actually, the Household survey indicates Full-Time employment DECLINED by 253,000.
Yep.
Declined, as in went down. Last month, total Full-Time Employed was 123,447,000. This month, it is 123,194,000. Down 253,000.
You can see for yourself at the St Louis Fed’s user-friendly FRED website. Look for data series LNS12500000. (Employed-Usually work Full-Time)
https://research.stlouisfed.org/fred2/data/LNS12500000.txt
James, serious question.
Do you believe that any of these statistics are reliable? Do you believe they are broadly free from political influence and manipulation?
What do you say to those who see these not-to-bad stats month after month, yet the experience in their lives and in that of their circle of friends and acquaintances tells a much darker story? Should they not believe their lying eyes?
Hi David.
FYI – James P. rarely comes out to play.
I don’t want to answer for James, but my own take is that they are largely reliable. The folks at BLS are professionals and (I think) do an OK job.
But there are two surveys, the Establishment Survey and the Household Survey. The usual headline payroll numbers come from the Establishment survey. The Unemployment Rate comes from the Household Survey. Both are valid methodologies.
However only the Household Survey reports on Full-Time Employment, which is my own go-to jobs number. These are the kinds of jobs a person might be able to build a life around. You can find it easily at the St Louis Fed’s site. It is data series LNS12500000. And the history of Full-Time Employment as illustrated by that data set squares with the every-day experience you talk about.
The numbers peaked in November of 2007 and then crashed in the Great Recession. They usually bounce back smartly during recoveries but this time they lagged badly. In fact, they did not surpass that November 2007 peak until August of 2015, almost eight years later. We had, in the labor market, almost a ‘lost decade.’
A big chunk of the jobs being created are in the “hospitality” industry. Not great paying work. Second, we are constantly hemorrhaging manufacturing jobs. Mining and energy are in the pits too. I know it’s not fashionable to worry about that, but those are the jobs that used to put the food on a whole lot of middle class tables.
Lets also not forget that it is an election year and the bi-partisan budget blew away the spending caps to provide all kinds of goodies. Lots of consulting work for the professional and Higher Ed crowd. When you look at rail and ocean traffic, steel production, earnings of energy and industrial company’s etc the picture is less clear. Despite a massive gas dividend, consumer spending, 70% of GDP, we are seeing less than 1% GDP growth. Bad weather cannot explain that away.
I believe the FED is waiting for the next President, whomever that is, for political reasons to deliver the next hit and it will be a massive to the capital markets. 20% or more to the S&P as an example. 66% of Apple’s core revenues is in cell phones. Does anyone think this will continue to grow? Dividends alone will not be able to mask the peak in earnings and lack of prospects. If you are not at least 15-20% of cash by the end of the summer then prepare to reset your long-term financial goals.