Ricochet is the best place on the internet to discuss the issues of the day, either through commenting on posts or writing your own for our active and dynamic community in a fully moderated environment. In addition, the Ricochet Audio Network offers over 50 original podcasts with new episodes released every day.
 The Poverty Hockey Stick
A few years ago I came across a plot of the poverty rate for US families from the year 1959 to 2011. Surprise! It’s a “hockey stick” plot with a well-defined blade covering over a decade of rapid change, and a decades-long “handle” in which the rate bobbles around a bit but shows no clear long-term trend. I’ve replotted it below, but you can find the same chart (minus the red- and blue-dashed lines, which I’ll describe below, and with recessions marked in) on Page 32 of the US Census Bureau publication titled “Income, Poverty, and Health Insurance Coverage in the United States: 2011”.
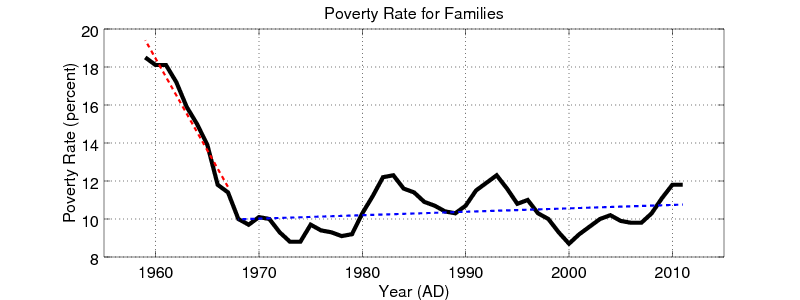 In the “blade,” which runs from the beginning of the data in 1959 up to some time around 1970, poverty declined steadily at a rate of about 1% per year. Then the “handle” begins, and the decline in poverty ends. Instead, the poverty rate bobbles around 10% or so, and perhaps rises very slowly as the decades pass.
The two dashed lines are simple least-squares fits to the data in the “blade” and “handle”. Rather than choosing the transition year by eye, I fitted lines for all possible transition years (i.e., every year in the range that left at least two points to define each line) and then picked the fits that had the smallest residual error in a least-square sense. The slope of the red “blade” is indeed very close to -1%/year (more precisely, it’s -0.965%/year) and the slope of the blue “handle” line is close to zero (it’s 0.018%/year). You can see that the lines fit the data pretty well.
Poverty in America was declining steadily and fairly quickly. But something went badly wrong around 1970.
So what went wrong? The years around 1970 were eventful ones: the US effort in the Vietnam War peaked in 1968, Apollo 11 landed on the Moon in 1969 … and the War on Poverty programs were getting established. Lyndon Johnson aide Joseph Califano is quoted in Wikipedia as saying, “From 1963 when Lyndon Johnson took office until 1970 as the impact of his Great Society programs were felt, the portion of Americans living below the poverty line dropped from 22.2 percent to 12.6 percent, the most dramatic decline over such a brief period in this century.” Comparing that statement to the plot shows that these programs took effect starting around the middle of the “blade.” They weren’t implemented all at once, but came in over a period of time from the mid-to-late 1960s.
In other words, the War on Poverty couldn’t have caused the rapid decline of poverty, but it might have ended that decline.
Published in Economics
fascinating. Thanks!
Has anybody ever done a comparison to compare the poverty rate with the amount of poverty?
You mean like seeing if there a growing bulge camping out just under the line, maximizing ease*comfort?
Interesting, I said to myself. What happened in or around 1970? Well, first thing I notice when I look at the data for myself is that they changed the definition of poverty:
So let’s throw out the pre-1970 data, because it doesn’t exist, apparently. We’re not comparing the same things.
The hockey stick is actually bigger than that; the steep decline goes back to about 1950, you just have to combine data from more sources.
The best article I know of on the topic is:
And given that we’ve had 50 years of the War On Poverty, now would be a pretty good time to assess the results and do something decisive.
Have you tried stimulus?
I’m not convinced that’s enough of a difference to make the slope of the poverty rate go from -0.9%/year to +0.05/year.
Poverty is notoriously difficult to measure as the value of the things that matter changes wildly over the years. The real question is, was poverty growing or shrinking before the War On Poverty, vs. growing or shrinking after the War On Poverty started? A truly successful War on Poverty would cost less over time.
Before then, we’re defining poverty as “an income less than three times the cost of the economy food plan.” Poverty is being defined entirely in terms of the price of food — as Orshansky freely says: “Despite the Nation’s technological and social advance, or perhaps because of it, there is no generally accepted standard of adequacy for essentials of living except food.”
After 1969, it’s tied to the CPI — a basket of commodities including food, beverages, housing, apparel, transport, medical care, education, recreation, and other goods and services. We went from defining poor as “hungry” to defining poor as “lacking goods and services commonly taken for granted by members of mainstream society.”
It’s a comparison of applies and oranges. Some 25 percent of draftees in the Second World War showed evidence of malnutrition. Publicly- funded nutrition programs were accelerated during the early 1940s because of that. Now, some 70 percent of the draft-age population is ineligible to serve owing to obesity.
I agree that the interesting question is whether poverty rose or declined. If we stick with the common-sense, original definition of poverty, I think we’d find it declined very strikingly. (I would guess this is less the effect of the War on Poverty than it is the effect of the second and third agricultural revolutions.)
Nothing went wrong in 1970. The definition changed. The measure for poverty (income) was always a proxy for ‘real’ poverty (malnutrition, infectious disease, and exposure).
The great society programs gave specific assistance to combat malnutrition – food stamps, school lunches, etc; infectious disease – medicaid; and exposure – public housing, section 8, direct cash assistance, etc.
The trouble is that the measure (income in this case) was not updated to account for the benefits provided by food stamps, medicaid, public housing, direct cash assistance, and other interventions.
Since 1970, the measure has simply been a comparison of the lowest sextile of income to a backward looking CPI and thus you end up with a fluctuating number that floats between 9 and 12%. I speculate that the ratio actually looks at the rub between wage growth and inflation.
There is no poverty in America, not in any meaningful sense.
Could you share the dataset you came up with for calculations?
Sounds, once again, like Democrats jumping in front of a already moving parade so they can claim to have led it.
Claire Berlinski, Instugator, et al: Good catch on the change in the definition of poverty. At some level we really do seem to have two data series, despite their being tabulated and plotted as one in the Census Bureau document.
Serves me right for failing to read the fine print when dealing with government data!
Ball Diamond Ball: I probably shouldn’t post the whole set here. The data are on page 62 of the document I cited, in the column labeled ‘All families’ -> ‘Below poverty’ -> ‘Percent’.
Don Tillman: Thanks for the link. I’d thought it strange that nobody seemed to be commenting on the striking change in the behavior of the poverty rate the plot showed. From the article:
The Census Bureau counts a family as “poor” if its income falls below specific thresholds,[3] but in counting “income,” the Census omits nearly all of government means-tested spending on the poor.[4] In effect, it ignores almost the entire welfare state when it calculates poverty. This neat bureaucratic ploy ensured that welfare programs could grow infinitely while “poverty” remained unchanged.
Huh.
Nice article, Don
A thundering lot changed in the 1960s, which is why social science has become a Rorschach test: what someone claims is cause-and-effect probably says more about him than reality. In most science, you have a control group and then you introduce one variable so you can see the effect of that one variable. But the Great Society Congress made several massive changes all at once, plus the world itself changed.
It’s true that we had the Great Society anti-poverty programs come on at about the same time that poverty stopped declining. So one could make the case that, as Reagan once quipped, we declared war on poverty and poverty won.
But it’s also true that we relaxed the immigration laws in 1965, so we effectively started importing far more poor immigrants.
And it might well be that our prosperity in from 1946-1970 was rooted in the fact that Europe bombed itself back in the stone age from 1939-1945 (Asia did likewise from 1937-1945). America, which avoided the worst of WWII, had a peace time boom in manufacturing that faded once Italy, West Germany, Japan, South Korea, et al. got their factories running again.
What slowed the decline in American poverty—the Great Society welfare expansion, the surge of immigrants, or the rest of the world recovering? I’m not sure there’s any way to tell.
Hah! Yes, I once did a paper about the old Soviet Encyclopedia and the changing truths therein. Today’s liberalism (and don’t think it’s much different in other respects, either) has always relied on the same tactic. Even better if you can change the definition and then continue to rely on previous data to support the opposite of what it actually supports. My guess is that if you were to take a great many liberal “statistics” and correct for terminology, the things would look drastically different.
Great point Claire.
In half measure only.
It’s not quite so ideological as that, I don’t think. This is a big problem for historians, generally, no matter their political orientation. The reason I was quick to spot that is because that’s the first step of the routine checklist any historian goes through when looking at something like this. (Or at least, that’s what they used to teach us to do; I don’t know what the young’uns learn in school these days.)
BDB, were you the one who asked me why I was so unimpressed by Stephen Pinker’s book about the decline of violence? I keep meaning to answer that. Short answer is that it doesn’t seem to occur to him even once, in the course of 835 pages, to ask, “Could we have a reference class problem, here?”
That was me. IIRC, he dealt with this by making generous assumptions about possible spreads of meaning and made his case in spite of it. I’ll listen again (ugh — chewwwwy).
We may have also been talking about his The Blank Slate, which I find nearly definitive for the admissions against interest — the upbraiding he gives to crooked scientists who align with him politically, and the wealth of cited works he marshals to debunk some much-cherished, politically necessary lies of the left.
I find not only his conclusions agreeable, but his argumentation. I presume that his data is not bunk — I will have to let it go at that.
Charles Murray’s Losing Ground has a lot of good insights on this point. Essentially, he argues, the changes in social policy that manifested themselves in the Great Society, social perceptions of appropriate behavior, and the criminal law, served to create a permanent “underclass” of poor. I’ll link to a National Review article summarizing he main point that can be found here.
We have imported all of our poverty. They have arrived by the millions. Ted Kennedy started that, too, around 1965. Before that, we had stopped immigration.
The Democrats need poor people.