Ricochet is the best place on the internet to discuss the issues of the day, either through commenting on posts or writing your own for our active and dynamic community in a fully moderated environment. In addition, the Ricochet Audio Network offers over 50 original podcasts with new episodes released every day.

 The Income Inequality Chart the Media Never Shows You — James Pethokoukis
 When economists talk about income inequality, what exactly do they mean by “income?” Usually they are talking about market income, which is, as described in an enlightening new Minneapolis Fed paper, “wages, salaries, business and farm income, interest, dividends, rents and private transfers (such as alimony and child support), of all household members.”
Then you have disposable income, which includes market income but also adds in “all government transfers (such as Social Security, unemployment insurance and welfare) and subtracts tax liabilities. This is a measure of resources actually available to household members for spending.”
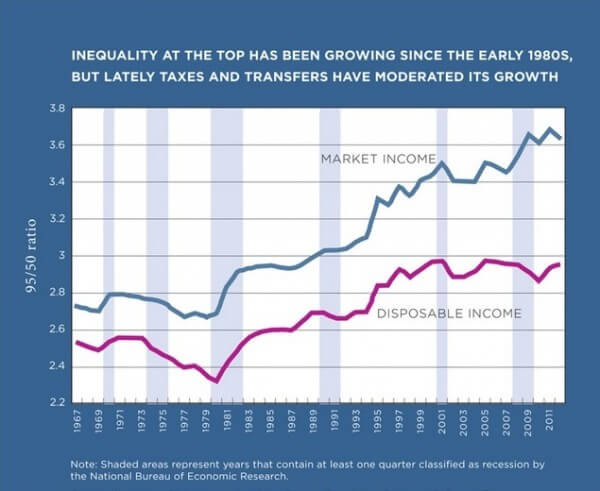
Turns out that when you are analyzing income inequality trends, it makes a great deal of difference whether you are using market income or disposable income, the latter of which gives a better feel for actual purchasing power. The above chart looks at inequality — as defined by the income ratio of the 95th percentile vs. the 50th percentile — using both income measures. From the Minneapolis Fed economist Fabrizio Perri:
The blue line in Figure 1 shows that since the early 1980s, there has been a sharp increase in market income inequality at the top. That is to say, market income for the high part of the U.S. household distribution (the 95) has been growing much faster than market income for the middle (the 50).
Less well-known are the dynamics of disposable income at the top, depicted by the red line in Figure 1. This line shows that over the 1980-96 period, disposable income inequality and market income inequality tracked quite closely.
After 1996, however, the two series started diverging: Market income inequality kept increasing at a steady pace, but disposable income inequality remained roughly flat. Indeed, over 1996-2012, market income of the top grew a total of 8 percent, while market income of the middle actually fell a total of 3 percent. Over the same period, however, disposable income of the top and the median displayed more similar growth rates of 8 percent and 5 percent, respectively.
This all suggests that despite increasing inequality in market income since the early 1980s, substantial government redistribution beginning in the mid-1990s, through taxes and transfers, has kept inequality levels in disposable household income quite stable. Interestingly, a big part of this redistribution appears to have taken place exactly during the Great Recession. Figure 1 displays this in the gap between the blue and the red lines; the market-disposable gap begins to open up in 2007 and has stayed at historical highs ever since.
Moreover, the data suggest that although inequality at the top in market income is currently at its historical high, inequality in disposable income has actually been flat or slightly falling over the past 15 years. This is because government redistribution between the top and the middle (the distance between the blue and the red lines) is also at its historical high.
One way, perhaps, to look at this data is that government redistribution has been offsetting a failure by the US education system to more broadly prepare a workforce for a labor market demanding greater skills.
Published in General
The fact that government redistribution has been narrowing the inequality in disposable income will be used as a cudgel to gain even more redistribution. Those other side effects? Who cares? We need more redistribution.
Do people who suggest that too much income (or wealth) inequality is bad or is a sign of something bad, think that little or no income (or wealth) inequality is good?
Has anyone ever calculated the Goldielocks range of income inequality?
I wish Republicans would respond to inequality (or racism) with the attitude that it’s a function of our society and any attempts to mitigate it will only cause more problems and open up more avenues to government corruption.
Like.
Or that its all vapor in an equities bubble driven by low interest rates.
They are still looking for Marx’s predicted revolution. Any century now…
Is is possible the government redistribution that has “helped” disposable income has actually contributed causally to the increasing gap in market income?
I wish there were a link, but Myron Magnet had an excellent article on liberty vs equality in the latest City Journal. He argues the two are largely incompatible, and those nations that have striven for equality have experienced bloodshed without achieving that goal.
I guess that I have a difficult time worrying about income inequality, because I have no idea why it is supposed to be bad – certainly the varied causes of income inequality range from what would be considered good (healthy entrepreneurship) to bad (crony capitalism, socialism), but I have a difficulty understanding the ‘why’ of income inequality, because it strikes me as based on envy.
That is the post I would like to see, why I should care about income inequality.
I am tempted to look at this as transfers are from the rich to the poor. I am not sure at all it is true that the transfers from the richer to the poorer are a key factor. In a era of high deficits it seem entirely possible that the transfers are not mainly from the rich to the poor (although that is certainly in part true) but rather from future growth. This reduction in future growth I would guess is regressive in nature (hitting poorer folks harder than richer ones). So transfer payments which are unpaid for may not end up being a good thing for those they are trying to help.