Ricochet is the best place on the internet to discuss the issues of the day, either through commenting on posts or writing your own for our active and dynamic community in a fully moderated environment. In addition, the Ricochet Audio Network offers over 50 original podcasts with new episodes released every day.
 Murder and Race in the United States
The current BLM narrative, peddled nonstop by the mainstream media, would make one think that it’s open season on black Americans and that the hunters are all whites. I think that this is a completely false narrative. The fundamental problem is black-on-black crime, particularly with respect to the worst of all crimes — murder.
I rely on the FBI’s 2018 Uniform Crime Reporting (UCR) data. I’ll provide specific links at the end.
I think that our pal Kozak has set forth an informative set of statistics in the comments of several posts, though if I recall correctly, his data was a bit old (from 2013, if I recall). I think that this is one of the graphs that he posted, which I was able to find online:

This is quite a persuasive graph. It raises three questions:
- Is it accurate?
- Are the current figures substantially the same?
- Is this a fair, or a misleading, presentation of the facts about murder in the US?
Technically, I’m not going to answer the first question, because I’m less interested in murder figures from 2013. The most recent figures available are from 2018, and I will present those, answering the second question. As you will see, the figures from 2018 are substantially similar to the 2013 graph above.
The third question is interesting. I think that this graph is a fair presentation, but it turns out to be a bit tricky. A graph like the example above has to be adjusted for population, which raises the question of whether the race of the victim or the race of the offender should be used to make the population adjustment. Fortunately, it’s not very hard to do both.
If you use the race of the offender for the population adjustment, you are asking questions such as: How often does a black person murder another black person? How often does a white person murder a black person? The focus is on the population of offenders. This is important because it shows what type of person is the real problem.
If you use the race of the victim for the population adjustment, you are asking questions such as: If you are black, how likely are you to be murdered by another black person? How likely are you to be murdered by a white person? This is also important because it shows what risks are faced by (presumably) innocent people.
I say “presumably” innocent because some murder victims are far from innocent. Some murders are doubtless the result of gang wars, in which no one is really innocent.
I limit this analysis to black and white Americans. Only 8.3% of murders in the relevant UCR data involved a person of other or unknown race, as either an offender or a victim.
I. By Race of Offender
Here is the 2018 graph of murder in the US, by race of the offender.

This is essentially the same result as the 2013 graph at the top of this post. This graph shows who is the problem with respect to murder. The big problem, adjusted for group population, is black people who kill other black people. The proportion of white people who murder a black person is tiny.
Murder is mostly intra-racial:
- 82% of the victims of black murderers are black, while only 16% of the victims of black murderers are white.
- 89% of the victims of white murderers are white, while only 8% of the victims of white murderers are black.
II. By Race of Victim
Here is the 2018 graph of murder in the US, by race of the victim:

This graph shows the risk faced by individuals, by race. Blacks are disproportionately the victims of murder, as they are also disproportionately the offenders.
Another interesting result of this graph is that whites face a higher risk of being murdered by another white than blacks. This is a good answer to Ta-Nehisi Coates, who wrote a misleading and hateful letter to his son in The Atlantic (here), about how afraid he was for his son after learning that the — entirely innocent — “killers of Michael Brown would go free.” Here are the facts:
- The risk that a white person will be murdered by another white person is more than twice the risk that a black person will be murdered by a white person, but:
- The risk that a black person will be murdered by another black person is almost six times the risk that a white person will be murdered by another white person, and:
- The risk that a black person will be murdered by another black person is more than ten times the risk that a black person will be murdered by a white person.
So perhaps Mr. Coates should keep his son away from other black people. White people are much safer for his son, statistically speaking.
III. Caveats, Data Limitations, and Technical Notes
Races do not commit crimes. No one was ever murdered by the black race, or by the white race. Murder is committed by individuals, some black, some white, some of mixed or other race. Murder victims, likewise, are individuals. I do not like this practice of treating people as members of groups.
It is reasonable to analyze the proportions of various groups who are the perpetrators and victims of crime. My analysis shows that black Americans are disproportionately the victims of murder, and that the overwhelming majority of their murderers are also black.
It is also not entirely accurate to conclude that “blacks” or “whites” face a certain risk of murder. Such figures are national averages, and vary widely between jurisdictions. My impression is that murder is very geographically concentrated, especially in inner-city and other poor areas, and most especially in the black inner cities. My analysis does not account for this (and does not even demonstrate that my impression is correct).
So, for example, my generalization of the risk of murder faced by the son of Ta-Nehisi Coates is unlikely to be correct for him as an individual. I was using him as a hypothetical example of an individual of a particular race. I suspect that Mr. Coates’s son is quite a bit safer than my kids, given his presumed wealth and status.
This analysis relies on data from the Expanded Homicide portion of the UCR. The UCR data table that details the race of both murder offenders and victims includes 6,570 total murders. Of this total, 6,025 involved an offender who was either black or white, and a victim who was either black or white. Here are the raw counts, in graph form:

Source: 2018 UCR Expanded Homicide Data Table 6 (here).
This is less than half of the total reported murders in the Expanded Homicide portion of the UCR, which is 14,123. (Table 1, here.) I presume that the FBI had insufficient information to categorize many of these murders by race.
The UCR Expanded Homicide figures used above do not include justifiable homicide, which is separately reported. In 2018, the UCR reported 410 justifiable homicides by law enforcement (Table 14, here), and 353 justifiable homicides by private citizen (Table 15, here). Thus, a total of 14,886 homicides are included in the 2018 UCR Expanded Homicide data.
This is lower than the 16,214 murders and nonnegligent manslaughters reported in the main UCR data (here). I have not reconciled this discrepancy. (Any insight would be appreciated.)
My population data is from the US Census estimates for 2018 (here): white population 236,173,020 (72.2%); black population 41,617,764 (12.7%).
A final note. This analysis generally confirms the 2013 graph shown at the top of this post, but the figures are up somewhat. This is because homicides are up. Here are the figures since 2013 (source here):
- 2013: 14,319 (45 per million)
- 2014: 14,164 (44 per million)
- 2015: 15,883 (49 per million)
- 2016: 17,413 (54 per million)
- 2017: 17,294 (53 per million)
- 2018: 16,214 (50 per million)
Notice the surge in 2015. Heather MacDonald has attributed that to the Ferguson Effect. The Atlantic article by Ta-Nehisi Coates was written in July 2015.
Ms. MacDonald has predicted that the Floyd Effect (my term) is going to make the Ferguson Effect look like a picnic. Sadly, I think that she will prove to be right. The bulk of the victims — and the perpetrators — will likely be black.
But to Mr. Coates, and the Left generally, those black lives apparently don’t matter. They matter to me. I want the cops protecting them, which means that the cops need to proactively fight the criminal element, with force when necessary.
God bless and protect our Thin Blue Line.
BLM delenda est.
Published in Policing
Here’s another graph I found recently.
Thanks. I wonder if there’s anything that overlays crimes committed for context.
It’s the morning after I created this post. It occurred to me that I performed the population adjustments that led to the graph in the OP based on the race of either the victim or the offender. I did not initially do any calculation adjusting for both. I’m not sure why this did not occur to me at the outset.
What the figures that result from such a double-adjusted calculation mean is not intuitively obvious, at least to me. The basic idea is to answer questions like: If you were the only black person in a country in which everyone else is white, how would your risk of being murdered compare to the the risk faced by your white fellow citizens?
The following graph includes the population adjustment for the race of both the victim and offender. The numerical figures seem meaningless to me, so I created a scaled score, in which 100 represents the risk that a victim who is either white or black is killed by an offender who is either white or black. Here is the result: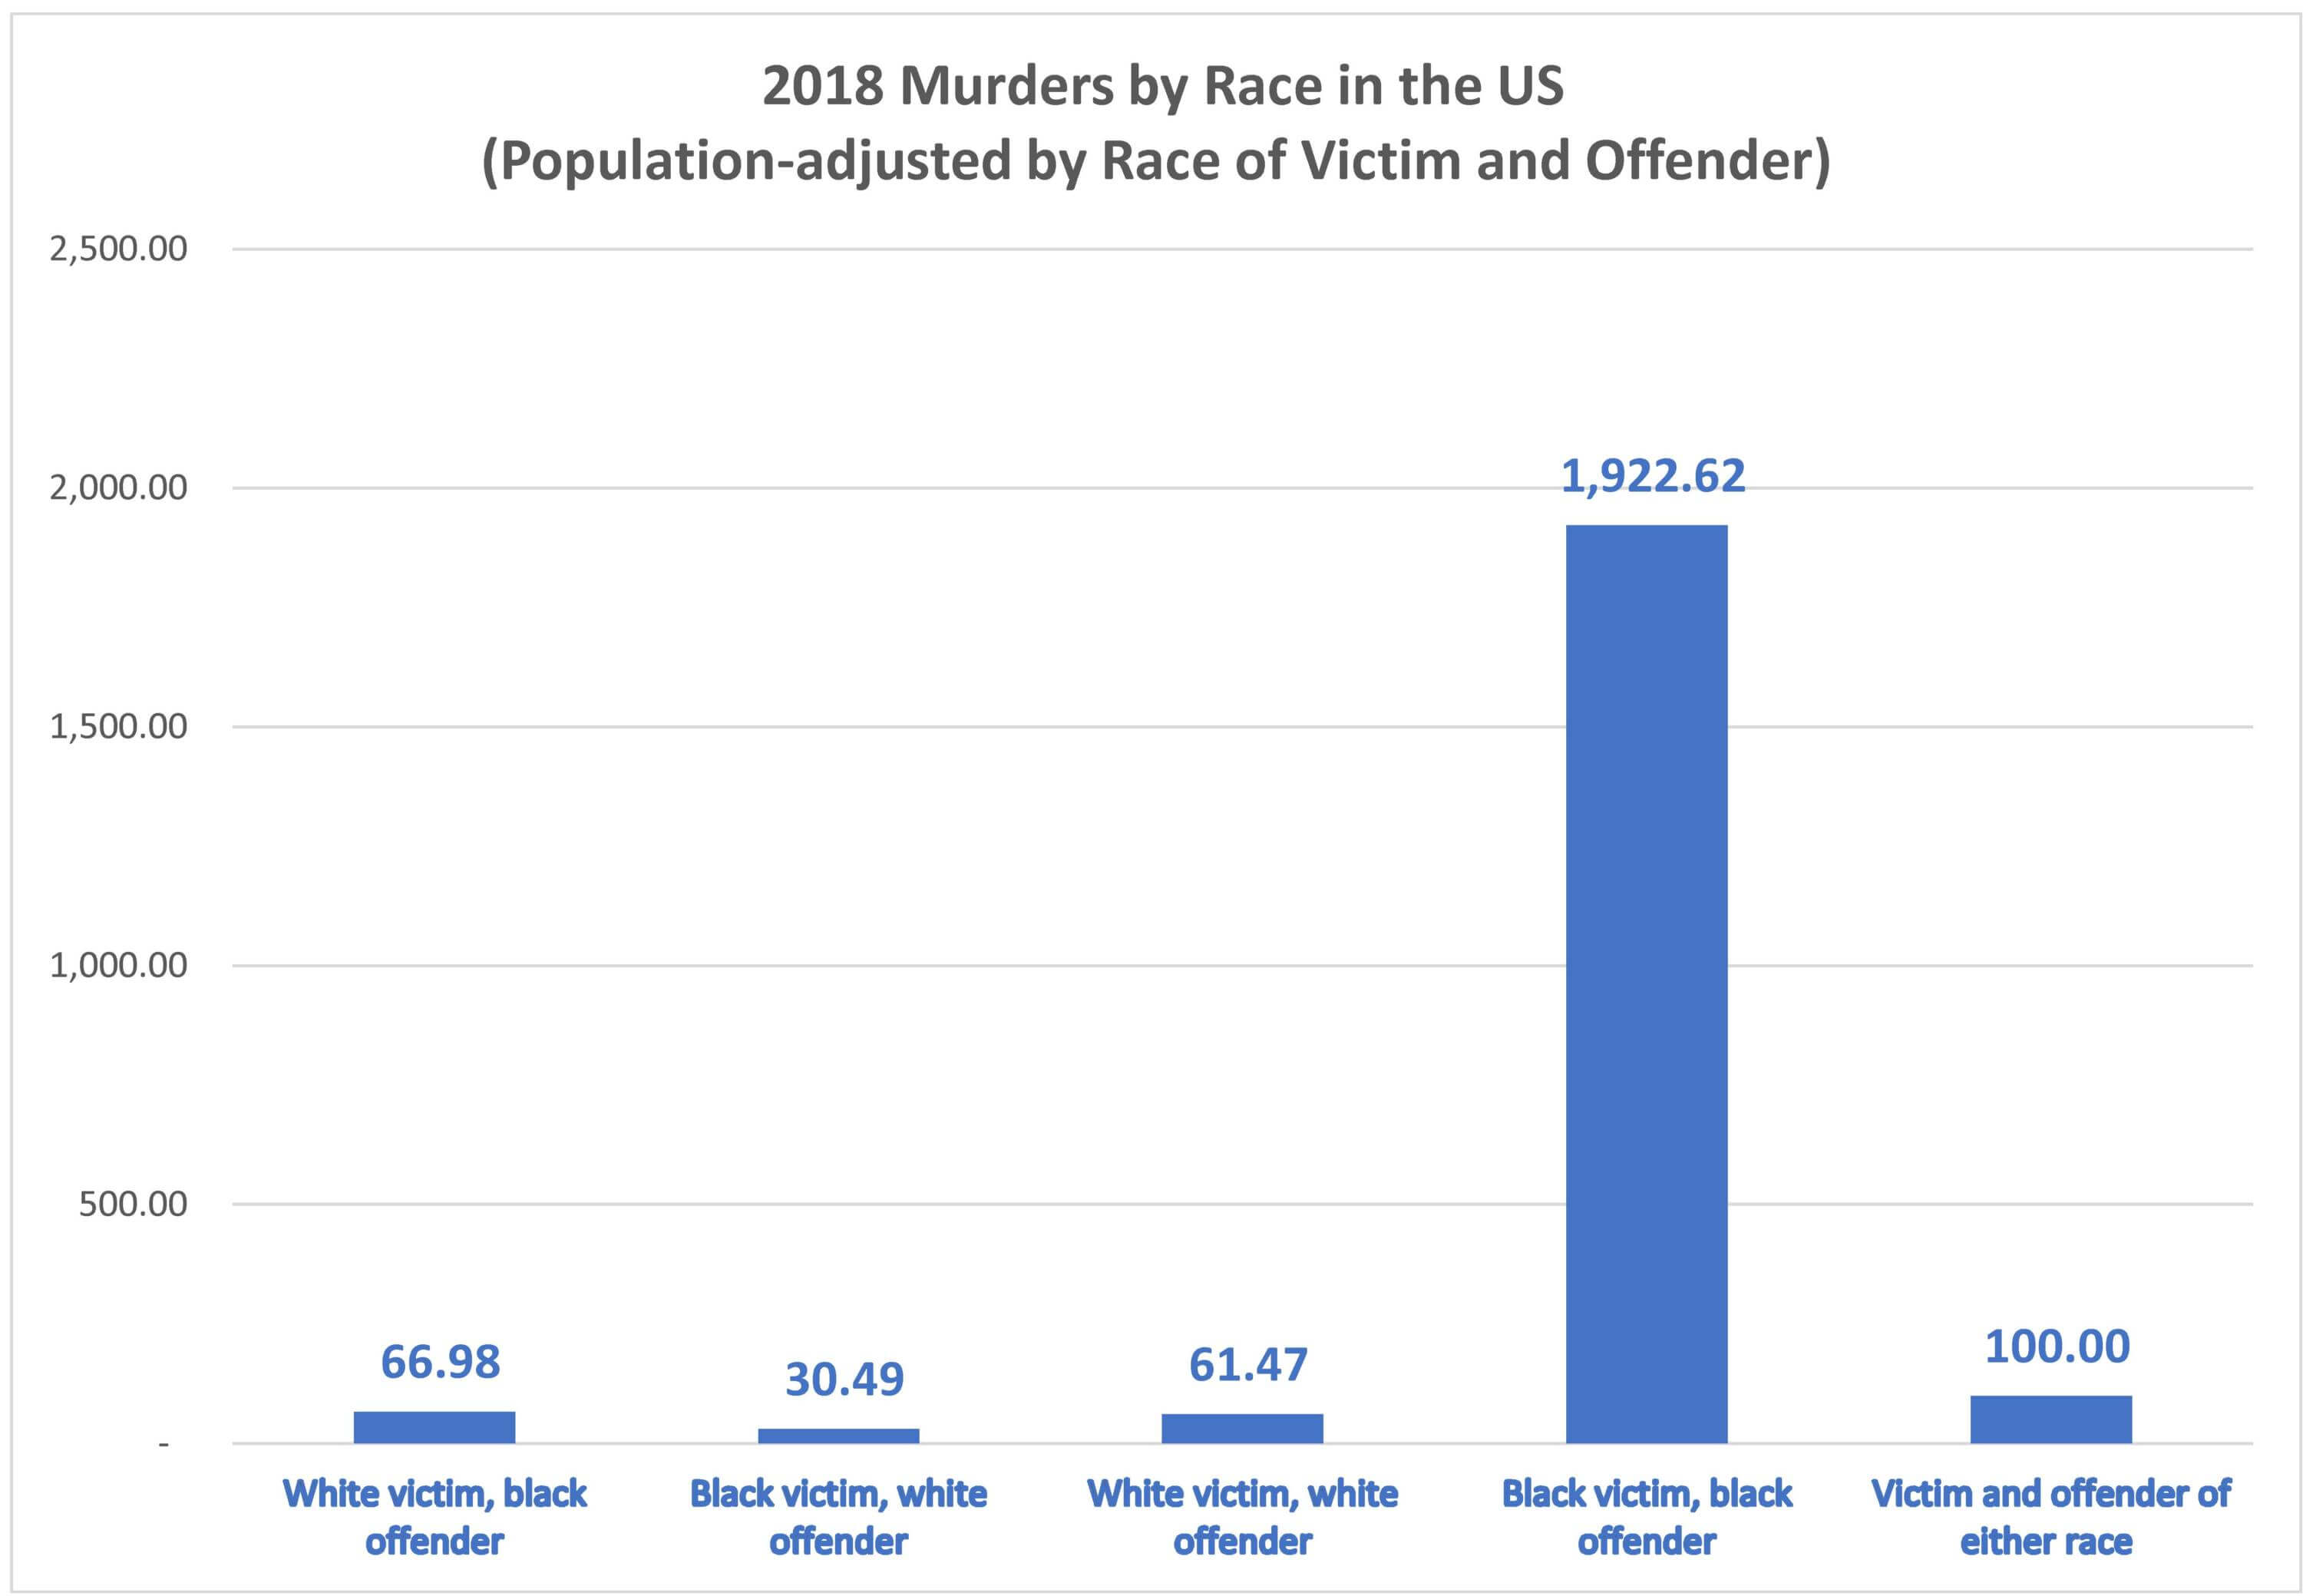
This shows that, after the population adjustment for the race of both the victim and the offender, the overwhelming problem is black-on-black murder. The least likely scenario is a white offender and a black victim. Black potential offenders pose a higher risk to white victims than white potential offenders, but the difference is minimal.
I think that the lesson is:
The statistical risk of murder posed to a black American by another black American is 63 times higher than the risk of murder posed to a black American by a white American, after adjusting for the race of both the victim and the offender.
As noted at the outset, interpretation of these figures is not intuitively obvious to me, so I’d appreciate any thoughts that you might have.
BLM camp-follower zombies are circulating little images on social media about the “myth” of black-on-black crime.
The complete rejection of the goal of black agency and self-reliance in favor of total, perpetual victimhood requires that urban slaughter be regarded as a symptom of systemic racism. Made into criminals by white people, arrested and killed in vast numbers by white cops and further victimized by the lack of gun control and jobs programs, only massive power transfers to a CHOP/CHAZ-like America can save these poor souls unfairly seen as violent thugs and dangerous morons. Actual statistics, actual preferences of African-Americans, and the depressing 50-years history of the aftereffects of past white lefty rescue efforts be damned.
Everything must be indexed to the relative share of the population that each racial cohort occupies, so if blacks are about 12% of the population and whites are 76% that means if the absolute number of murders committed by whites and blacks are approximately the same (they are) then murder committed by blacks is almost 6.5x as likely as it is in the white segment of the population.
Of course, FBI data collapses Hispanic and Caucasian into a single category: “white”. If you want to see some real disparities try disaggregating those numbers.
First of all, congratulations, Champ.
Second: I did “index” (i.e. population-adjust) the murder data by race. In the OP, I did so separately for race of the offender and race of the victim. The results were somewhat different. The part I’m uncertain about is my comment #3, in which I adjusted for race twice, to take into account the race of both the offender and the victim. I think that this is a proper thing to do, but I’m looking for confirmation.
Third: I don’t think that the data at issue (Expanded Homicide Data Table 6, here) allows the disaggregation that you suggest between Hispanic and other white. It is a good suggestion, but I don’t think that I have the data to do it. In this table, I don’t think that the separately reported information for Hispanics is a subset of whites (though I’m not completely sure about this). I think that it is possible to be both black and Hispanic, like Sammy Sosa.
I wonder what the rates of black-on-black murder were in the years before the Great Society programs kicked in. If the legacy of slavery and Jim Crow are the determining factors, I’d expect to see much higher murder rates in, say, 1950 than in 1990. If, as I suspect, the programs are part of the problem, the 1990 rate will be higher than that in 1950.
And it’s easy to show the inconsistency with the social determinism used here: Blacks who commit murder are the victims of a system, while white cops who kill people are personally responsible for their actions.
Bigger picture, the only way to have support for an argument about justice is to believe in personal responsibility. If people are not personally responsible for their actions (and to be fair, there is an argument to be made for this viewpoint), there is no human world of justice, simply a state of nature where sometimes the wolves get you and sometimes they don’t.
I’m pretty sure those protesting police-related killings want justice, though—so if they want their arguments to be logically consistent, they would need to accept personal responsibility. The choice is theirs.
I would argue no.
Once you have indexed for the race of perpetrator your work is essentially done. If you wanted to look at the data through the other end of the telescope you would take the raw data and index it for the race of victims to determine the raw probability of victimhood controlling for race, (which you have done) but it is essentially distortive of the data to index murder rates to representative fractions of the population and then do it again for the victims.
Let me see if I can convince you. I’m not trying to be argumentative. I appreciate your input, and I’m not entirely confident of my analysis on this point.
If you look at the third graph in the OP, “2018 Murders in the US (Per Million of the Victim’s Race),” you’ll see that the likelihood of being a white murder victim of a black offender is 2.18 per million, while the likelihood of being a white murder victim of a white offender is 11.33 per million. This is the result of adjusting the number of murders of white victims by the population of whites.
Does this mean that a black person is less dangerous to a hypothetical white victim than a white person? I don’t think so, because we haven’t yet adjusted for the population of potential offenders. In my data, there are about 5.7 times as many white people in the US than black people.
This would justify the second population adjustment, to account for the number of potential offenders in each racial category. This is what I did in my graph in comment #3 above.
This is the reason why even though I agree you could perform this analysis and it has a veneer of mathematical correctness, it points more to the fact that if you examine the raw numbers you should be struck more by just how much of a corner case interracial murders tend to be. It is precisely because these are incredible outliers that you can achieve some very lurid statistics. You have merely a single order of magnitude greater than statistical significance worth of data annually when examining such killings.
But therein lies the precise reason why outrage over killings of blacks by police is a sort of mug’s game played by grievance-mongers; they don’t want to wrestle with the bulk of where such killings lie because that would be both inconvenient and embarrassing to their cause. This would be akin to aspiring to rob a bank and settling for knocking over lemonade stands… you’re not exactly going where the money is.
Blacks have had higher rates of violent crime for a number of decades. This is from a chart from The Rise and Fall of Violent Crime in America by Barry Latzer.
Homicide victimization rates, male, by race, 1940-70
1940
Black (per 100K) 54.4
White (per 100K) 4.9
1950
Black (per 100K) 47.0
White (per 100K) 3.8
1960
Black (per 100K) 42.3
White (per 100K) 3.9
1970
Black (per 100K) 78.2
White (per 100K) 7.2
Again, these are just victimization rates, not offender rates; but, as now, most murders were intra-racial. For example, In Cleveland, OH, blacks were 16% of the population but were the victim in 70.6% of felonious homicide cases from 1947-1953. In these cases, whites were accused in 6 and blacks were accused in 320. In St. Louis, MO, blacks were 18% of the population in 1950. In 1949, blacks comprised 81% of the city’s homicide victims and 95% of the perpetrators in these black victim cases were also black.
I hypothesize that it was during the fights over segregation in the Fifties that the media first decided it was absolutely essential that negative information about the black community, especially negative information about crime, be kept from the general public.
Ever since then, the crime statistics have continued to appear in government reports and scholarly works, but only a brave individual here and there has been willing to tell the general public what is really going on.
Here’s a recent example from the great Heather MacDonald:
Far from destroying the black body, whites are the overwhelming target of interracial violence. Between 2012 and 2015, blacks committed 85.5 percent of all black-white interracial violent victimizations (excluding interracial homicide, which is also disproportionately black-on-white). That works out to 540,360 felonious assaults on whites [per year]. Whites committed 14.4 percent of all interracial violent victimization, or 91,470 felonious assaults on blacks [per year]. Blacks are less than 13 percent of the national population. https://www.city-journal.org/terrifying-collapse-of-the-rule-of-law
The end result of this suppression is the inverted image of crime and race popularized by Black Lives Matter, with appalling results as we’ve all seen.
Maybe it is not an inverted image of crime. Just a legalization and expansion of black crime on others.
BLM’s aim appears to be reducing police activity in the black inner city itself, so the main result is legalizing and expanding black crime that hurts blacks.
I think the white elites who support BLM understand that they can get anti-racism brownie points, while the resulting crime wave doesn’t hit them or their families in any significant way.
Instead the cost is primarily borne by the “Black Lives That Don’t Matter”.
I think that destroying any residual hope in the poorest neighborhoods is the plan. If all escape paths are closed then only the revolution can save those trapped in chaos and misery, which pain will be ascribed to “systemic” racism. The continued violence will generate selected martyrdom moments to mobilize idiot white undergraduates and the violent loser males collectively know as Antifa.
University presidents, Fortune 500 CEOs, all media companies will accelerate their ongoing capitulation to insatiable demands from the mob. Once enough of those acting in the name of the mob can vote early and often by mail (many from the grave or from the imaginations of the voting organizers, some even before crossing the soon-to-be ICE- and wall-free border) the entire government will be in the hands of the revolution and Idiocracy becomes a documentary. Schumer and Pelosi will go the way of the Girondists and Robespierre within a week as the Squad has them offed. (Take a look at the NY Dem primary results and tell me that the Schumeristas are not already toast.)
The squalor in poor black neighborhoods will quickly rival Havana or Caracas but with far more pro-revolutionary graffiti as consolation. And despite the victory of the revolution, “systemic” racism will somehow still be endemic, that requiring that complete power be in the hands of the leadership.
@oldbathos — I can’t really go along with these overwrought scenarios and conspiracy theories.
As far as inner-city crime is concerned, BLM is merely turning the clock back a decade or two. It’s not something new.
I won’t argue for a high probability of the worst case outcomes discussed above except to say they are logical consequences of the ideology under discussion, should it triumph.
As for ‘merely turning back the clock’, the riots and crime in the 60s and 70s were often characterized as frustration and impatience at the failure to realize the material promise of the civil rights movement. The current dysfunction seems to be happening in a context of heavily promoted despair. I think that is qualitatively different.
Obama failed. Racism explains everything. A hard left regime of some kind will deliver more benefits or if not, at least punish the privileged.
The answer in the past was the Great Society, more elected black mayors, DAs and police chiefs. If that is no longer a novel or acceptable solution, what’s next?