Ricochet is the best place on the internet to discuss the issues of the day, either through commenting on posts or writing your own for our active and dynamic community in a fully moderated environment. In addition, the Ricochet Audio Network offers over 50 original podcasts with new episodes released every day.
 Coronavirus: My Projection
I posted a preliminary projection yesterday (here), at the end of one of my regular reports, but I wasn’t very happy with it. Here is my official COVID-19 projection for the US. I’ll post it so that I can be properly humiliated if I’m wildly wrong, or improperly smug if I turn out to be right.
I’ll show my rationale, in case it is of any interest to you.
I’ve been closely tracking the changes in the rate of increase in reported deaths for each country. In my post yesterday, I got as far as creating a time-series of this variable for each country, with the data series for each country starting when it first passed 2.5 reported deaths per 100,000. My data source is Johns Hopkins as usual (here), and I’ve been analyzing the US and the Western European countries — Germany, the UK, France, Italy, Spain, and a combined “Other Western Europe” for the others (down to the size of Luxembourg).
I used a linear model yesterday, which didn’t seem quite proper, as I’d expect the rate of growth to follow something more of an exponential decay function. So I decided to do a logarithmic transformation in the regression, conveniently available in MS Excel via the “LOGEST” function.
The linear model takes the mathematical form y=mx+b. The LOGEST model takes the mathematical form y=bm^x, so x is in the exponent. If I recall the way that the math works on this one — and I think that I last studied this during the Reagan administration — the formula simply takes the logarithm of both sides of this equation and then does a linear regression (so y=bm^x is equivalent to log y = mx + log b).
Anyway, here’s how it looks applied to the data set for all of the Western European countries, plus the US:

The “days offset” indicates the number of days after March 1 on which the series starts. So, for example, Italy is offset five days (starting March 6), and the US is offset 24 days (starting March 25).
This looks like a pretty decent fit, but I’m not very happy with the far right end. It looks like the estimate line is consistently overpredicting the rate of growth after 20-30 days. I’ve blown this up in the next graph, which shows only days 16-30 from the graph above (note that some countries drop out, because they have not yet reached their day 16).

It really looks here like there’s overprediction at the right end of the curve. I could go back to the drawing board and create a different mathematical model, but I don’t have anyone to please (or answer to) except myself, so I decided on an alternative approach. I created an alternative estimate curve based solely on the data for days 16-30. Here’s what it looks like:

So I decided to use the red estimate line for the first 15 days (and actually to project backward before March 1, also), and use the blue estimate line for days 16 onward. I did this analysis with data through April 4, which was day 11 for the US. So the change in projection estimate occurs on April 9.
Here’s how the projection looks for cumulative deaths — 95,574 through July 5, 2020:

If that looks eerily familiar to you, you’re not alone. I can only give you my assurance that I did this calculation completely independently, but here’s how it compares to the latest IHME graph, first cumulative:

Not much difference, is there? I labor mightily to tell you what you already knew. Here’s how it looks on a daily basis:

So what did I learn? Basically that I agree with the IHME model. This actually is useful information to me.
ChiCom delenda est.
Published in Healthcare
Very impressive.
Am I correct that this is straight curve fitting, and not based on any kind of model of population behavior, accumulated immunity, regional density, etc.? It’s simply (and I use the term advisedly; as I said, I’m impressed) a numerical extrapolation of current data based on an assumption about the ultimate general shape of the curve?
So, if it turns out that America has a small number of hot spots a la New York City, is that likely to change the curve? Given that our highest density urban area may be well ahead of the curve of the rest of the US and therefore closer to the downward slope, is it perhaps weighting the curve? Or am I clutching at straws here?
Well done.
Yes, it is just curve-fitting.
The strange thing is the consistency throughout Europe. If there’s going to be a sequence of “hot spots” in the US, I would expect the same thing to have occurred in Europe. That is, first Italy skyrocketed, then Spain, then there were smaller spikes in France and the UK, and Germany remains quite low. Yet the rates of increase are declining pretty much everywhere, and very consistently.
This analysis is limited to the national level. I have not evaluated the rates of increase in reported deaths by region in the US, except in NYC.
Nice work
I’m going to take the under.
I predict under 93,000.
IMHE adjusted its projection to 81,000 deaths in USA.
I predict under 81,000
Okay…now explain to me why this week is our Pearl Harbor/911?
Whatever the number, always divide by 350 million.
81,000 comes out to 0.023143%.
The US population is more like 330 million, but this makes no meaningful difference to your point, which is an extremely low percentage. Even if you up it to my prediction — say rounded to 100,000 — the percentage only increases to 0.03%.
I don’t understand why there is no second phase in the predictions. We are not staying at home forever. What is the terminal percent of population infected, when herd immunity is achieved? Will it be 30% (Spanish Flu)? 50 (Swine Flu)% or 70% (German estimate)? Or, some other number.
I’ve been using 330 million but maybe 350 million is more accurate
It looks as though US death reporting just got corrupted.
Also, here is some data from NYC. It confirms the male privilege here. We die more from COVID-19.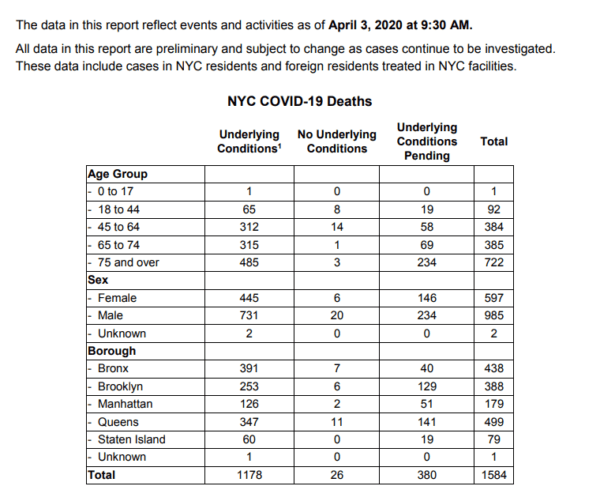
Yeah, I see things starting to level out. What’s with the “this’ll be the worst week ever!” language?
Two reasons why the second wave may be reduced or eliminated. One is hydroxychloproquine early and the other is a vaccine late (after Labor Day). If this turns out to be seasonal, then a moderated second wave may become an annual event like flu season. There is some concern that the virus is mutating (typical of rna viruses) so multiple strains will have to be in a vaccine each year, both H and N mutations or even more. Polio has three types that were all included in the vaccines.
WA governor just announced that schools are closed for the rest of the year. Apparently, that’s how we respond to good news…
Oh, we got that two weeks ago, when our numbers were far below what Washington was experiencing at the time.
I’ve also read that the guidelines in reporting cause of death due to Coronavirus is very liberal. And they are not recording date of diagnosis, verses date of reporting. I guess they usually do that as a standard.
This site https://swprs.org/a-swiss-doctor-on-covid-19/#latest has a lot of information that gives food for thought. It is a running blog type day by day.
Basically, medical protocol is based on how the Chinese tackled the virus. It is now being questioned if ventilation contributes to lung damage, see especially this link US physicians have also come forward who describe intubation as „more harm than good“ for patients. He equates it to altitude sickness, and seems kind of at a loss to what we are really dealing with. He is a NY ICU dr.
From the website referenced above:
The younger test-positive deceased almost always had severe pre-existing conditions. For example, a 21-year-old Spanish soccer coach had died test-positive, making international headlines. However, the doctors diagnosed an unrecognized leukemia, whose typical complications include severe pneumonia.
Remember the young ESPN sportscaster that died around Christmas from pneumonia and they discovered he had undiagnosed cancer?
If you have time, it is worth looking at. Perhaps everyone has been thinking we know what is going on, but maybe that is not the case. Maybe it is time to take a time out to regroup.
also, it seems women’s xx chromosomes mean she has more fighting chance than a males xy, because it is the x that does a lot of work here.
I’ve also read that the guidelines in reporting cause of death due to Coronavirus is very liberal. And they are not recording date of diagnosis, verses date of reporting. I guess they usually do that as a standard.
This site https://swprs.org/a-swiss-doctor-on-covid-19/#latest has a lot of information that gives food for thought. It is a running blog type day by day.
Basically, medical protocol is based on how the Chinese tackled the virus. It is now being questioned if ventilation contributes to lung damage, see especially this link US physicians have also come forward who describe intubation as „more harm than good“ for patients. He equates it to altitude sickness, and seems kind of at a loss to what we are really dealing with. He is a NY ICU dr.
If you have time, it is worth looking at. Perhaps everyone has been thinking we know what is going on, but maybe that is not the case. Maybe it is time to take a time out to regroup.
also, it seems women’s xx chromosomes mean she has more fighting chance than a males xy, because it is the x that does a lot of work here.
It’s good to see the recovering numbers increasing daily at twice the number of deaths. But I know that not all states are even bothering to record recoveries. Learned today that Wisconsin has no standard way of declaring a recovery, and so they’re just not reporting any. Makes me wonder how large our recovery numbers really are.
I don’t think because of the greater widespread use of HCQ cocktail that past experience with the CoronaVirus can be used to predict the future. Also it appears that my LA County total number of cases has turned down after being mostly flat in the amount of new cases for a week. I think that experience will be true for most of the country but perhaps not for the hotspots, which can’t be totally explained.
Tony Boselli, 5 time Pro Bowl offensive lineman for Jacksonville and USC Trojan, was in ICU for covid 19. Age 47. Treated at Mayo Clinic in Jacksonville, FL.
He said he felt better after doctors gave him hydroxychloroquine.
He is back home now recovering but he was healthy enough to tell his story today on Dan Patrick and Rich Eisen.
Graphs which use lessons from late-winter outbreaks to project outbreaks in early spring may do so at their peril. Maybe not, but maybe.
Also, a funfact: Present hospitalizations in NY are one fourth what the IHME model had originally projected for today, and Cuomo claims they are slowing, yet IHME has not adjusted expected NY deaths downward.
Methinks they are stubbornly averse to pleasant news.